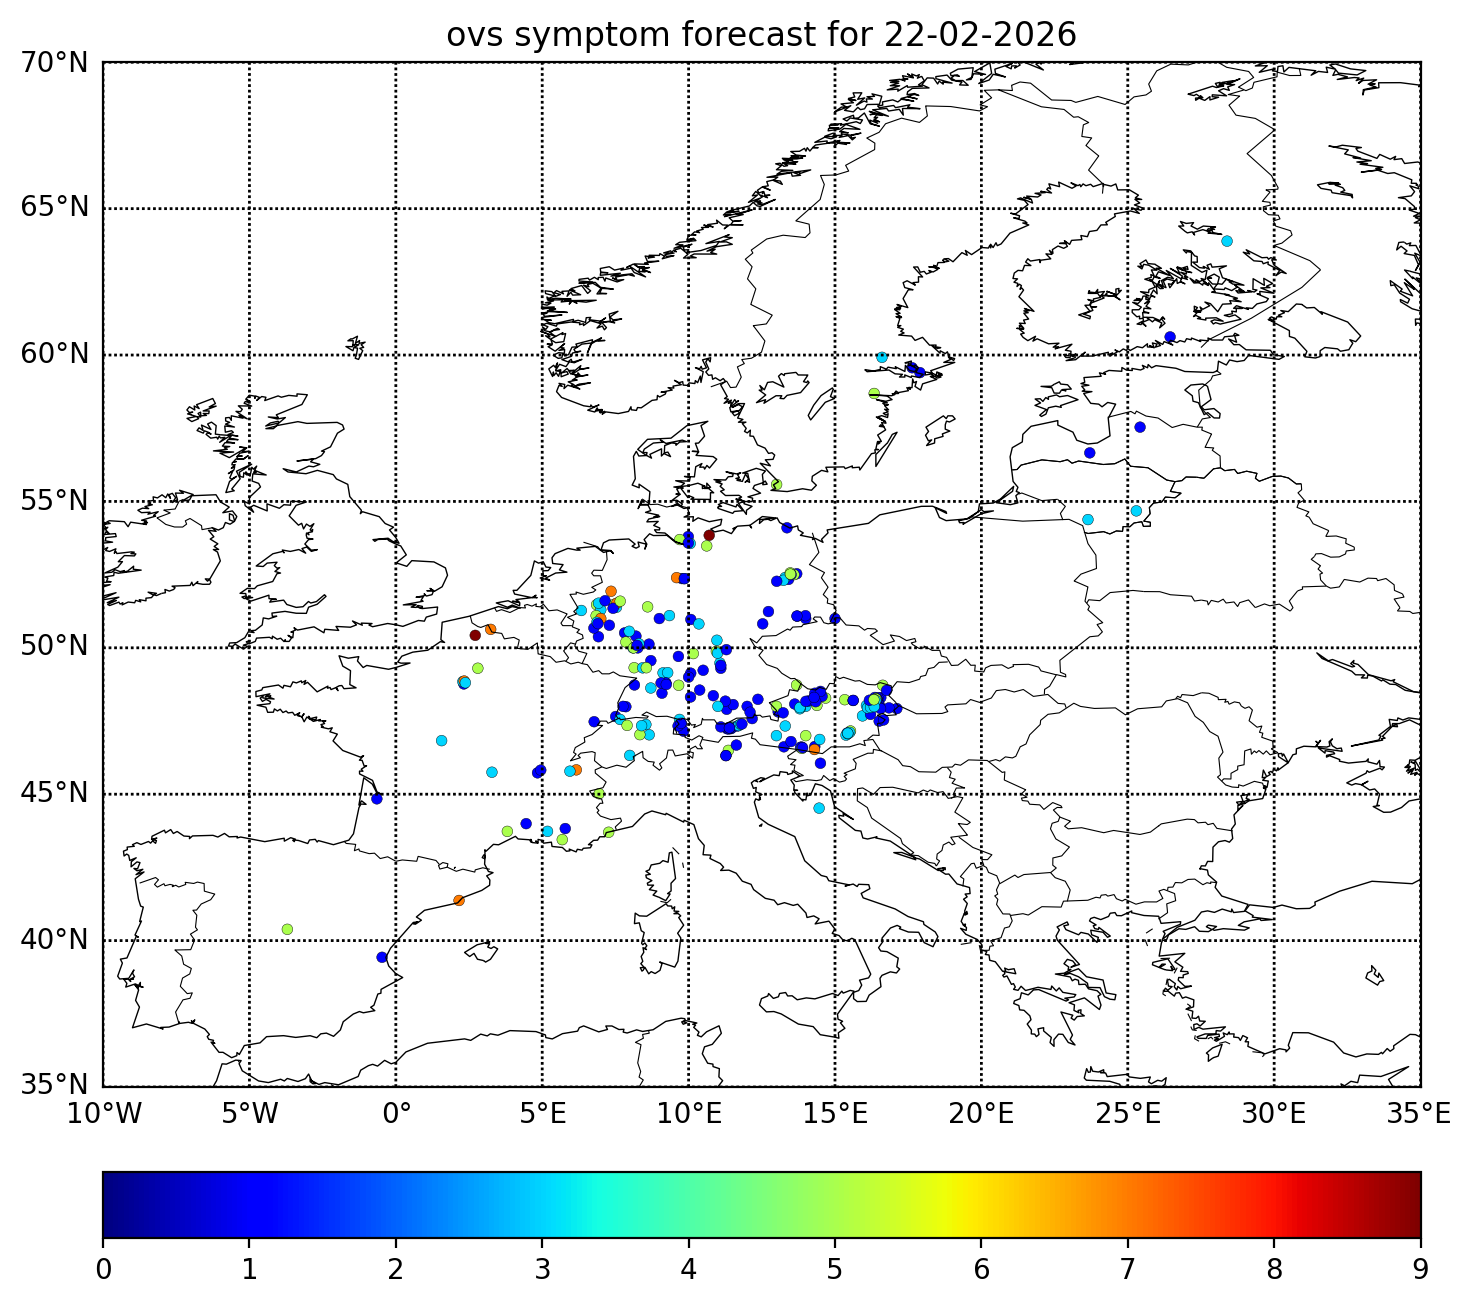
Allergy Symptoms Forecast
A unique personalised allergy symptom forecast has been developed to provide more information on symptoms associated with airborne pollen allergies. The information on the maps is indicative and does not include personal information.
Allergy Symptoms Forecast

The Allergy Symptoms Forecast is based on a combination of anonymised users' Pollen Diary entries from users and data on airborne pollen load, meteorological conditions and air pollutants. The symptom forecast is specific to the function of the nose, eyes and lungs, as well as to health conditions. The allergy symptoms forecast is presented in circles with different colours and numbers on the axis (in ascending order). Blue indicates the absence of symptoms, while red represents the most intense manifestation of the predicted symptoms. Additionally, the higher the number on the scale, the more intense the manifestation of the predictable symptom.
